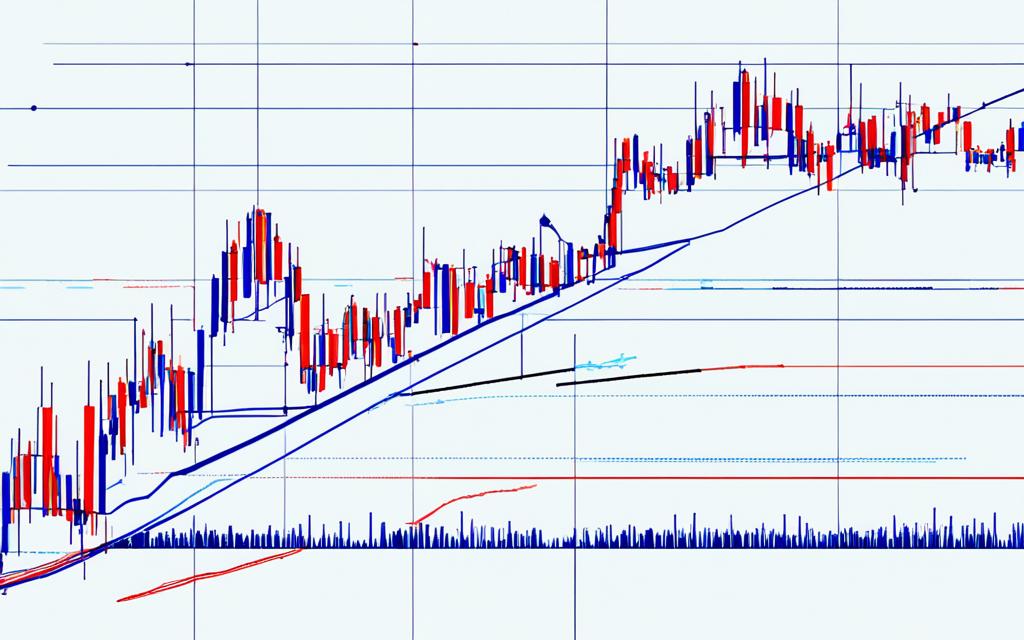
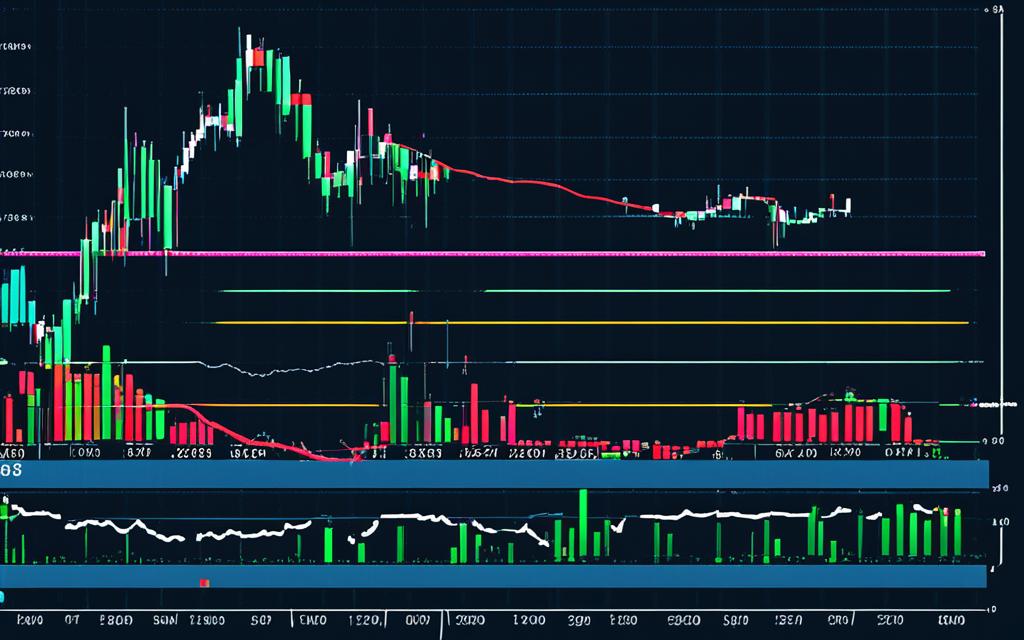
How to Get VWAP on ThinkorSwim: A Comprehensive Guide
Did you know day traders use the volume-weighted average price (VWAP) for insights? It helps track intraday price movement and a stock’s liquidity.1VWAP combines price and volume on charts, showing market trends. The thinkorswim platform lets you easily add VWAP to your charts. No need to calculate anything.
Thinkorswim is a popular platform that’s easy to use. It lets traders of all levels add VWAP to their strategies. This can help you make smarter trading decisions.
On charts, VWAP looks like a line, similar to a moving average. This helps traders see trends and points for entering or leaving trades.1VWAP is calculated all day, reflecting real-time price movements and volume. It is a helpful tool for trading efficiently over short periods.
Each new trading day, the VWAP calculation starts fresh. This means it always reflects the current market, giving traders the most accurate information.1Want to know how to add VWAP to your ThinkorSwim charts? In the next section, we’ll guide you step by step. You’ll learn how to use VWAP in your trading strategy.
Key Takeaways:
- VWAP helps day traders understand price movement and a stock’s liquidity.1
- Adding VWAP to ThinkorSwim charts is easy. You don’t have to do the calculations yourself.
- On charts, VWAP appears as a trend line. This helps find the best times to trade.1
- VWAP shows current market conditions by calculating throughout the day. It’s great for short-term trades.1
- VWAP starts fresh every day, reflecting the current market. This keeps trading decisions informed.1
What is VWAP?
VWAP means volume weighted average price. It’s key in trading, showing the average stock price by trade volume. By adding up the price of each trade times its volume and then dividing it all by the total volume, traders get clues about a stock’s liquidity. They also learn what price both buyers and sellers see as fair right now.
Institutions and algorithms lean on VWAP for getting the average price of big orders. It reflects both price and volume, giving a clearer average price picture. This makes it a hit with traders aiming to understand the market and make wise moves.
VWAP quickly shows how a stock’s price is moving throughout the day. Day traders watch it closely. If VWAP is going up, it could mean prices are going up too, signaling a good time to buy. If VWAP is going down, prices might follow, suggesting selling could be smart1.
VWAP’s calculation starts fresh each trading day. This offers hints about potential trends and reversing prices. Drawing VWAP on charts lets traders easily see a stock’s price compared to this significant midpoint, much like a moving average.
Understanding VWAP involves looking at how it fits with various trading methods. When merged with other tools like moving averages, it becomes more powerful. This makes it handy for knowing good points to enter and leave trades. Also, VWAP acts as a moving support and resistance zone, hinting at when stocks might be over- or under-valued.
VWAP gives traders a handle on average prices, market trends, and how liquid the market is. But, it shouldn’t be the only tool in a trader’s box. For the best outcomes, pair VWAP with other analysis methods and tools. This will help traders act with more knowledge.
“VWAP is a crucial insight for traders. It lays out a stock’s liquidity along with a buy-sell consensus on its fair price.” – Reference 1
How to Plot VWAP on ThinkorSwim
On thinkorswim, users can easily add VWAP to their charts. They don’t need to know the formula. Just go to the Charts tab and add a symbol for an intraday chart. Then click on Studies, select Add Study > Market Strength Studies > VWAP1. VWAP will then show on the chart as a line, revealing insights on intraday price action.
Looking at VWAP on thinkorswim helps traders understand a security’s average price, factoring in volume. It shows how this price relates to live price changes. This helps spot trends and check the market’s strength by looking at both price and volume. Adopting VWAP into analysis is easy thanks to the platform’s features2.
On thinkorswim, VWAP appears as a line, like a moving average, with upper and lower bands. These bands, based on standard deviations, reveal if a security might be overbought or oversold. By checking the price’s position against these bands, traders can plan their entries and exits better.
Moreover, thinkorswim has various studies and indicators to go along with VWAP2. By adding VWAP to tools like volume profile, anchored VWAP, Ichimoku cloud, and RSI, traders get stronger signals. This combo can give a better view and more confidence in trading decisions.
Being able to use VWAP on thinkorswim is a real plus for traders. It allows them to understand intraday trading better and market health. With VWAP, prices, and volume data for insights, traders can refine their strategies. Thinkorswim is great for this with its easy-to-use platform and features2.
Using VWAP as a Reference Point
VWAP is key for deciding when to enter or exit trades. It shows if prices might go up or down by how its line slopes. A rising VWAP hints at prices moving up, while a falling VWAP suggests prices could drop. This data guides traders on when it might be best to act3.
VWAP is like using a moving average to spot trends in stock prices. By examining the VWAP indicator, traders can guess where the price is headed. Yet, using VWAP alone isn’t enough. Pair it with other tools for more accurate trading choices and to better understand the market’s trends3.
The thinkorswim platform highlights overbought and oversold levels with VWAP bands. These bands are above and below the VWAP line. Prices near the upper band signal they’re likely too high and will maybe fall soon. But, prices nearing the lower band indicate they’re probably too low and might go up soon3.
Using VWAP’s slope and price positions with the bands can better inform trading decisions. It offers insights into the market’s mood, helping navigate different market conditions. Thus, incorporating VWAP deepens your analysis and improves your trading strategy3.

Example:
Seeing the VWAP line rise all day hinted at prices moving up. This, combined with prices nearing the upper band, indicated an overbought market. Therefore, I chose to sell and take my profits3.
To wrap up, VWAP is invaluable for knowing when to trade. It gives clues on future price movements by its slope. Remember to use VWAP with other tools to craft a robust trading approach3.
Understanding VWAP During Trading Hours
VWAP is a key tool for understanding price and volume action in real-time. It helps short-term traders see how much buying or selling is happening. They use this info to make smarter trading choices.
To understand VWAP, traders look at the price’s movement compared to VWAP. If the price goes below VWAP but ends up above it soon, more people might be buying. This could mean the price is going up1.
Short-term traders use VWAP to decide when to enter or exit trades. Looking at VWAP helps them see if the trend is strong. Then, they can decide on their next move1.
VWAP is always being calculated as the market moves. This gives traders real-time data on how prices and volumes are behaving1.
But, it’s important not to just rely on VWAP for trading. It works best when combined with other tools like moving averages and RSI. This makes your trades better14.
In short, VWAP is valuable for short-term traders. Along with other indicators, it boosts their trading decisions. This leads to better trading outcomes14.
VWAP as a Support and Resistance Level
VWAP stands for Volume-Weighted Average Price. It acts as a support and resistance level on a chart. This happens by looking at how the price moves near VWAP over time. So, traders use VWAP to spot where prices might pause or turn.
When a price hovers close to VWAP, it might mean the market is unsure of what to do next. This setting could help traders figure out good times to get in or leave a trade.
VWAP’s upper band can signal a price is too high, and buying might slow down. Its lower band can show a price is low, so less selling might happen. Then, the price might go back up.

Bollinger Bands can make understanding overbought and oversold areas easier. They show when prices have pushed too far, possibly about to reverse. This can guide trading actions.
Combining Statistical Data from Multiple Sources
Mixing data from different sources gives a deep look at VWAP’s support and resistance role. Each source shines light on different aspects, together helping traders time their moves well.
“VWAP is recalculated each day as the market opens. Watching how prices react to the bands around VWAP can give hints on future moves.”1
Link 2’s data dives into technical VWAP calculations. It talks about the methods used to set up VWAP levels for support and resistance.5 offers these details.
“The approach involves checking 20 recent price bars to set up VWAP lines. These lines are aligned with pivots to give clearer support and resistance signals. The script also adjusts VWAP lines by 2.0 ticks to show different levels effectively.”5
These data combos help traders understand VWAP well. This knowledge aids in making better trading choices within today’s market atmosphere.
Combining VWAP with Other Indicators
Traders can improve how well VWAP works by mixing it with other indicators. These include moving averages, the RSI, and Bollinger Bands. This mix gives traders better signals and clearer views of market trends and potential price moves.
Moving averages are a good choice to add to VWAP. They spot when trends are changing. For instance, a price increase above VWAP and a short-term average higher than the long-term one suggest a good time to buy. When it’s the other way around, it might be a good time to sell. This method helps traders see if a trend is strong and then make smarter choices in trading.
The RSI helps show if a stock is overbought or oversold. It tells if recent price changes are too high or too low. Together with VWAP, it can point out the best times to enter or exit trades. If a stock price and RSI are high while above VWAP, it might be time to sell. If they are low while below VWAP, it could be a good buy signal. So, using RSI with VWAP helps traders pick better times to trade.
Bollinger Bands are also great to use with VWAP. They show if a stock is about to significantly move in price. Combining them with VWAP can help spot times when a stock could break out or return to an average. For example, if a stock price breaks the upper Bollinger Band while VWAP is also rising, it might suggest a buy opportunity. On the contrary, a price drop below the lower Bollinger Band while VWAP is going down might signal a chance to sell. This combo lets traders find more reliable trading chances.
Pairing VWAP with various indicators gives traders a broad look at the market. Looking at many indicators together helps validate trading choices and boost chances of success. Yet, no single strategy guarantees wins. Good analysis and risk management are key for trading success.
Advantages and Limitations of VWAP
The VWAP has many pluses for traders. It mixes data on a stock’s volume with its average price1. This helps traders see how easily they can buy or sell shares without greatly affecting prices.
VWAP gives an average price based on how many shares are bought and sold1. This makes it an important guide for what the stock’s real value might be at any given time. It’s also calculated all through the trading day, giving live updates on price and trading activity1. This can be handy for traders looking to make quick or short-term moves.
Institutional traders and trading programs find VWAP very useful for its ability to blend large trades in the market efficiently1. It helps these big players avoid pushing a stock’s price too high or too low when trading in bulk. Hence, on platforms like ThinkorSwim, VWAP is shown as a line, comparing it to how a moving average might look1. Bands that go along with it show levels where a stock might be traded too much or too little, giving insight to smaller traders1.
VWAP isn’t perfect, though. It might not react quickly enough to sudden price changes or new market trends1. This means traders should not bet everything on what VWAP says. It’s suggested to mix VWAP with other tools and methods for smarter trading1.
Customization with Anchored VWAP
There’s another option for traders who want more control: anchored VWAP. This lets traders pick a specific starting point for their VWAP calculations, like a special date or event4. Doing this offers finer details, showing support and resistance lines more clearly and checking on how well trades are doing4.
Using an anchored VWAP can make analysis more precise and keep a check on trades over long periods6. It becomes a guide for making decisions and can confirm important trade points6. But, it’s not perfect either. Choosing when to start the anchor point is a bit up in the air. Also, there’s a chance it could be slow to react, not showing the most current market info, and could be manipulated6.
Conclusion
VWAP is a key tool for intraday traders. It shows a security’s average price, spotting trading chances. But, it works best when used with other tools. This way, traders can dive deeper into market trends.
For any trading plan, technical analysis is vital. VWAP is very handy here. It shows how easy it is to buy or sell a stock and points out good times to do so. This makes it a must-have for traders.
Data7 highlights how VWAP tells about a stock’s liquidity, and where it might find support or face resistance. Adding anchored VWAP, as Brian Shannon suggests8, lets traders tweak VWAP’s start point. This gives them more insight into the market’s movements.
To succeed, traders need to know the market well. VWAP, combined with other analysis tools, boosts strategy success and precision. It’s about understanding the market in depth for making smart trades.
FAQ
How can I plot VWAP on ThinkorSwim?
To plot VWAP on ThinkorSwim, first, go to the Charts tab. Next, add a symbol and choose an intraday chart. Then, go to the Studies menu and pick Add Study > Market Strength Studies > VWAP. You’ll see the VWAP line on your chart.
What is the significance of VWAP in trading?
VWAP, also known as the volume-weighted average price, shows how easy it is to buy or sell a stock. It serves as the average price at a specific time. This helps day traders with important decisions, like when to enter or exit a trade.
How does VWAP differ from a simple moving average?
VWAP and a simple moving average both spot trends. Yet, VWAP looks at the volume and price of each trade. It gives a more precise average price based on trading volume.
Can I use VWAP to gauge buying and selling activity during trading hours?
Yes, watching the price compared to VWAP can show buying or selling trends. For example, a price lower than VWAP but then closing above it quickly might signal more buying. This could push prices higher.
How can VWAP act as a support and resistance level on a chart?
VWAP can act as a support and resistance that changes with the trading day. Prices stalling around VWAP suggest slow movement. If a price surpasses VWAP after being below it, it might keep rising.
Should I combine VWAP with other technical indicators?
Combining VWAP with other indicators like moving averages improves trade signals. These additional tools can spot more opportunities and warn about overbought or oversold conditions.
What are the advantages of using VWAP?
VWAP has several benefits. It uses trading volume for a more real-time average price. As a widely accepted metric, many traders and institutions keep an eye on it.
What are the limitations of VWAP?
VWAP might not react quickly to sudden price swings, as it’s a backward-looking measure. It’s best used with other tools to make well-rounded trading choices.
Is VWAP a valuable indicator for trading strategies?
Yes, VWAP is useful for understanding a stock’s average price and spotting trading chances. Yet, it’s more effective when used with an array of analysis tools for a full trading strategy.
Source Links
- https://www.schwab.com/learn/story/how-to-use-volume-weighted-indicators-trading
- https://haikhuu.com/education/how-to-add-vwap-on-thinkorswim
- https://usethinkscript.com/threads/ultimate-vwap-indicator-for-thinkorswim.1681/
- https://trendspider.com/learning-center/vwap-indicator-a-comprehensive-guide-for-traders/
- https://usethinkscript.com/threads/anchored-vwap-indicator-for-thinkorswim.171/
- https://trendspider.com/learning-center/anchored-vwap/
- https://www.litefinance.org/blog/for-beginners/best-technical-indicators/vwap-indicator-what-is-vwap-in-trading-and-how-to-use-it/
- https://scriptstotrade.com/alphatrend-smart-vwap/


